“[To be a superior investor,] this is the bottom line: not whether you dare to be different or to be wrong, but whether you dare to look wrong.” – Howard Marks, Oaktree Capital Management
The toughest qualification for being a successful investor is the ability to stick with a strategy even when it’s not working. Even when the strategy is making you look foolish. Even when there was much money to be made by following a different strategy.
One consequence of following an evidence-based investment strategy is that your portfolio does not look like a traditional portfolio. Your level of diversification is much higher. Unlike your friends, you may not even own a single stock — only disciplined, diversified funds. Your level of trading? Very likely much lower.
The expected result from this deviation is superior performance over time. Why else would we choose this strategy in the first place? However, to be able to earn this superior performance, returns would have to be different over any given month or year. Different, which can mean either higher or lower. And when that difference is lower, investing can be quite unenjoyable.
Let’s focus on diversification as an example. Most US investors primarily hold US stocks in their long-term portfolio. More sophisticated investors tend to accept the rationale for diversification and end up with far more diversified portfolios. To explore these two approaches, let’s compare the historical performance of US stocks vs the performance of a very simply diversified portfolio of US stocks, foreign stocks, and US REITs.
| Investment | Annualized Return | Standard Deviation | Sharpe Ratio |
| US Stocks (S&P 500) | 10.5% | 15.4% | 0.33 |
| Foreign Stocks (MSCI EAFE) | 10.0% | 17.3% | 0.27 |
| US REITs (FTSE NAREIT All Equity REITs) | 12.1% | 17.2% | 0.39 |
| Simple Average | 10.9% | 16.6% | 0.33 |
| Actual Diversified Portfolio | 11.3% | 14.0% | 0.42 |
Looking at the performance table above, the diversified portfolio beats US stocks in terms of returns, standard deviation of returns, and risk-adjusted performance as measured by the Sharpe ratio. It seems like an easy decision to go with the diversified portfolio over just US stocks — better returns, lower risk, where’s the downside?
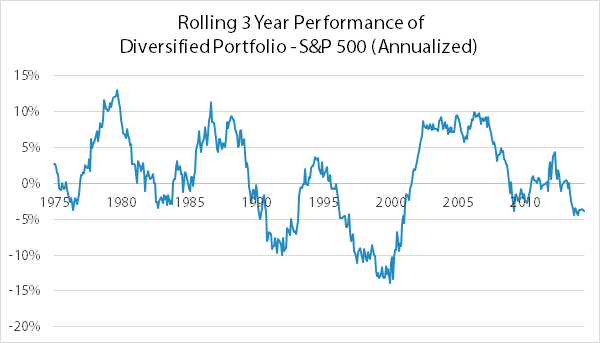
However, those superior results were earned over a period of more than 40 years. As investors, we don’t experience investment returns 40 years at a time — we assess it far more frequently. The following chart shows the return of the diversified portfolio relative to the S&P 500 over rolling 3 year periods. When the line is positive, the diversified portfolio did better than the S&P 500 over the prior 3 years. When the line is negative, the diversified portfolio did worse.

Over these 40 years, there have already been 6 distinct periods when holding a diversified portfolio looked foolish, with one of those occurring right now. Two of those periods looked completely disastrous for diversification. Try to imagine the resolve needed to stick with a diversified portfolio in the early 1990s and then again in the late 1990s, while everyone around you is profiting from following a naive US-only strategy. It can take years for the “right” strategy to actually outperform.
Although diversification may seem like a “free lunch” when looking at the table of 40+ year returns, the chart above exhibits the price we do pay for that superior performance. The price is that occasionally we will look wrong, and some of those times completely wrong and foolish. It takes an independent, disciplined mind to be able to withstand these periods and not give up on a strategy that we expect to perform better over time.
Figuring out how to earn superior performance over time is not too difficult. Even just following Basic Strategy would be a noticeable improvement for most investors. However, having the discipline to stick with such strategies, especially when it looks wrong in the moment, is a far more difficult task.

