Last month, we used the P/E ratio to predict stock market performance over next 1 to 20 years. This time, let’s try using another valuation metric: the Q ratio. An easy way to calculate Q is by using the Federal Reserve’s Z.1 data, which was just refreshed last Thursday. And as mentioned previously, we know that predicting stock market movements profitably is extremely difficult, so we need to proceed with care.
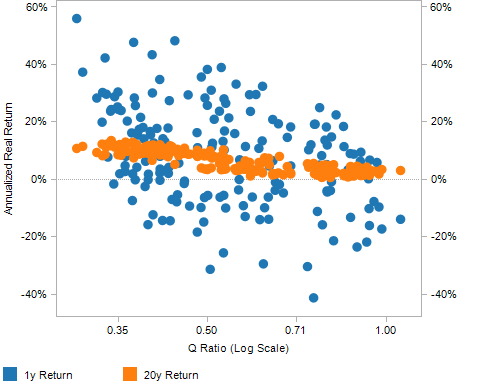
Using data since 1945, the chart below shows the historical relationship between Q and S&P 500 returns over the following 1 and 20 years (annualized and adjusted for inflation).

Source: Robert Shiller data, Federal Reserve data, and Mariposa calculations as of 12/13/2010
The two sets of data look completely different. 1-year returns (in blue) are not only highly volatile, their relationship with Q ratios is also not very consistent. The 20-year annualized returns (in orange) are more stable as expected, and they also show a stronger, more consistent relationship with Q ratios. It looks like Q ratios are helpful in predicting stock market returns, but the predictions are only reliable over the long-term.
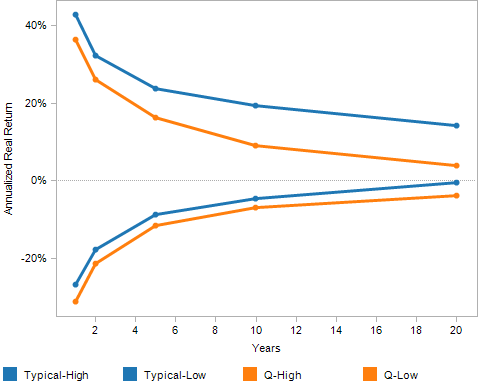
To see the benefit of using Q ratios, let’s predict returns for the next 1 to 20 years starting at an S&P index level of 1240 (12/13/2010 close), which Q estimates to be 67% overvalued. The lines below show the range of predicted returns (plus/minus two standard deviations) with and without the use of the Q ratio.

Source: Robert Shiller data, Federal Reserve data, and Mariposa calculations as of 12/13/2010
The two blue lines show the typical range of returns calculated simply from historical returns. The two orange lines show the range of returns predicted by the Q ratio based on current market levels. Even with the market estimated to be 67% overvalued, the two ranges do not seem materially different until 5- or 10-year predictions, so we can only consider Q ratios to be helpful when predicting returns over such long time periods. For short-term predictions, Q unfortunately joins P/E in the unreliable category.
However, the historical relationship between Q ratios and returns does tell us that we should expect lower returns than what’s typical over the next 10 to 20 years.

